img-hero-mobile
img-hero-1
icon-white-doc
WHITE PAPER

The 2025 Smarter Purchasing Report for Pharmacies

How Pharmacies Unlock Savings and Enhance Their Operations With Smarter Purchasing

icon-doc

Download the white paper

Complete this form to get the PDF version of our white paper.

bg-shaped shaped box bg mobile

The 2025 Smarter Purchasing Report

Modest shifts, promising trends, new challenges and expanding issues: This purchasing report walks pharmacies through all the data and shows them how to succeed.

The pharmacy industry is a dynamic field with no shortage of challenges. Providing the best patient care and operating efficiently means doing more than keeping the doors open.

SureCost wants to help pharmacy professionals learn how to thrive in this competitive industry. We publish our annual Smarter Purchasing Report to share how successful pharmacies can enhance patient care, save money and optimize work.

Methodology

SureCost collects anonymized pharmacy purchasing data each year from a nationwide cohort of pharmacies. We remove outliers to standardize this data for a realistic “apples-to-apples” comparison. SureCost’s leadership then examines each dataset to address potential anomalies. Customer interviews provide qualitative data, while industry research and experience help frame the trends.

For this summary, the SureCost team then averages the data to provide key findings and salient points to guide other pharmacy professionals. We also offer explanations based on the data, conversations with customers and our experience in the pharmacy business. But the pharmacy purchasing ecosystem is complex and dynamic. A wide range of variables affect purchasing, so we keep collecting and examining the latest data from our network and throughout the market. These quantitative and qualitative insights inform the key findings in this report.

compare
Data-backed insights to help pharmacies cut costs and boost care.

Opportunities for Savings and Efficiency Through Smarter Pharmacy Purchasing

This year’s report focuses on five key advantages of smarter pharmacy purchasing. We’ll discuss them one at a time, but it’s important to consider them as elements of an overarching strategy. Throughout the analysis, we’ll also highlight the critical role of robust, flexible technology and business intelligence.

Pharmacy Purchasing Beyond the Top 200

The 200 most frequently purchased generic drugs guide most pharmacies’ purchasing decisions. The list helps pharmacies gauge demand and stock the right products. But when it comes to the best purchasing options, sticking to just the “Top 200” means missing out on savings and better deals.

As the table below shows, pharmacies can unlock significant savings opportunities by purchasing outside the Top 200. In 2024, taking advantage of more options and competitive pricing from across the market enabled pharmacies to reduce their cost of goods sold (COGS) by approximately 10% on average.

Average Pharmacy Savings Outside and Within the Top 200 in 2024
COGS savings outside the Top 200 10.11%
COGS savings within the Top 200 9.15%
Savings outside the Top 200 $135,491,998.94
Savings within the Top 200 $119,644,903.96
Total savings $255,136,902.90
Ratio of savings on products outside the Top 200 53.11%
Ratio of savings on products within the Top 200 46.89%

SureCost continues to see this strategy succeed every year. In 2024, pharmacies once again reduced their COGS by purchasing beyond the Top 200. They also reported that access to a wider range of products opened up bulk discounts, rebates and negotiating better terms through an expanded vendor portfolio. These pharmacies also gained additional safeguards when drug shortages hit.

Pharmacies saved over $255 million in 2024 through smarter purchasing.

Purchasing outside the Top 200 still delivers stronger savings. We do see a slight downward trend in overall savings percentages compared to 2023 and a marginal narrowing of the gap between savings within and outside the Top 200. These modest differences may indicate potential shifts in the market or product pricing. Pharmacies hitting primary vendor targets on a more regular basis or vendor consolidation are other possibilities. But purchasing outside the Top 200 still delivers stronger savings.
53% of savings came from purchases outside the Top 200.
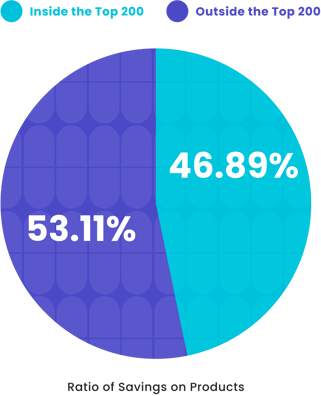
Ratio of Savings on Products Inside vs. Outside the Top 200 (2024)
pie chart-agnostic
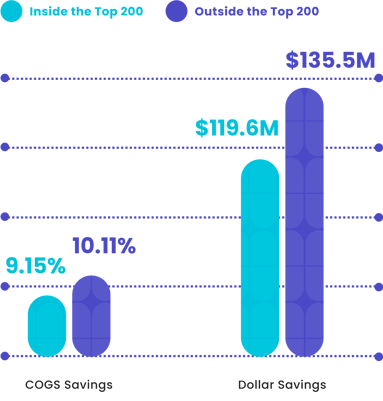
COGS Savings Inside vs. Outside the Top 200 (2024)
bar chart-agnostic
icon-checklist
Drug Shortages Continue

The American Society of Health-System Pharmacists reported 309 drug shortages by the first quarter of 2024, the highest number in nearly a decade. The number has decreased since then. But 271 active drug shortages (at the time of publication) still pose a significant challenge to patient care. Many pharmacies convene standing committees just to combat drug shortages.

Smarter purchasing has empowered pharmacies to mitigate the impact of drug shortages. Diversifying their vendor portfolio and leveraging accurate data about available alternatives allows pharmacies more options when a drug shortage hits. Automating replenishment and transfers means sudden out-of-stocks won’t catch them by surprise.

Gain Visibility With Smarter Pharmacy Purchasing

While purchasing outside the Top 200 yields substantial savings, it often means a lengthy, often stressful shopping experience. Opaque by design, the pharmacy purchasing ecosystem buries better purchasing options under a mass of vendors, catalogs, categories and purchasing interfaces. They might find some savings, but lose money and time navigating a fragmented purchasing landscape.

Using a smarter purchasing solution like SureCost, pharmacies quickly and easily compare all their options, including their primary vendor, secondary vendors, GPO and buying directly from manufacturers. Integrating all of their sources and data into a single solution allows pharmacy teams to shop and submit purchase orders using one interface. The system also monitors primary vendor compliance while revealing better purchasing options. Pharmacies save more by finding new purchasing opportunities and don’t have to worry about regulatory compliance with their existing agreements.

Pharmacies saved more—and stayed stocked—by expanding beyond the Top 200.
Vendor Substitutions

SureCost continues to see a trend of unwanted vendor substitutions: vendors substituting different products for what pharmacies ordered without informing those pharmacies.

Without the right solution in place, a pharmacy may not discover a vendor substitution until it receives deliveries. Many fail to notice the substitution altogether, not realizing they don’t have the right item or that they overpaid until much later.

That means pharmacies are literally not getting what they paid for. Different products lead to inconsistencies within the pharmacy’s purchases and inventory. Staff must then update records, relabel products and inform healthcare providers and patients. When patients don’t receive the medication they expect, it can compromise their treatment plans.

Summary of Vendor Substitution Findings
Average unnotified vendor substitutions among generic purchases 0.64%
Highest amount of unnotified vendor substitutions among generic purchases 8.56%
Average change in COGS due to vendor substitutions 0.03%
Highest increase in COGS (based on annual generic purchasing volume of $35M) $127,690

For SureCost customers, the average number of vendor substitutions remained low, affecting less than 1% of their generic purchases in 2024. Looking at previous years and across all segments, the average substitution rate has remained consistently low for SureCost users, within less than a quarter of a percentage point.

Year-Over-Year Vendor Substitution Rates in Generic Purchases Among SureCost Pharmacies (2022–2024)
Year-over-Year Vendor Substitution Rates -agnostic

On average, we saw a negligible impact on COGS due to vendor substitutions (versus the more noticeable cost increases in 2023 and 2022). The average COGS impact decreased in 2024 compared to the prior year. These trends may point to some favorable substitution pricing or improved pharmacy purchasing controls.

Still, a low substitution rate can result in significant financial losses for high-volume pharmacies. While most pharmacies are shielded from frequent substitutions, the data shows that even low-frequency events can be financially impactful at scale.

Even low vendor substitution rates can cost pharmacies over $127K a year.

Even a <1% substitution rate can cost high-volume pharmacies up to $127,690 per year.

icon-star
Lowering COGS is a critical strategy to mitigate other financial challenges.

That’s why competitive pharmacies leverage every available means to keep finding the best purchasing options and only pay for items they ordered.

Increase Vendor Substitution Awareness

While unexpected vendor substitutions create multiple issues for pharmacies, checking every package against each purchase order is tedious. Pharmacy teams don’t have the time for such a tedious process.

With a solution like SureCost, when a pharmacy receives a substituted item, the system automatically flags the discrepancy and calculates the difference in cost (positive or negative) against the initial purchase order. Pharmacies can then immediately address it with their vendor. If they prefer, they may even use their solution to prevent suppliers from substituting items altogether!

Avoiding Sudden Vendor Reorders

Reorders are a reality for most pharmacies, often triggered by unanticipated demand spikes or late replenishment. But, as the data shows, reorders are common but costly.

Vendor Reorders Summary
Average number of reorders for purchase order line items 2,277
Average percentage of reorders for all items 1.02%
Highest percentages of reorders 18.15%
Average increase in COGS due to reorders 0.004%
Highest increase in COGS due to reorders $1,954,551

Comparing the percentage of reordered products against the number of line items on a purchase order illustrates the scope of this challenge. In 2024, on average, pharmacies reported reordering 2,277 items due to vendors’ inability to fill their orders.

The good news is that reorder rates have been declining since 2022. This drop may suggest that more clients are using SureCost Inventory ManagerTM to forecast more effectively and adding vendors to improve stock transparency, resulting in higher vendor fill rates.

Reorders from vendor issues drove COGS up by nearly $2M.
Year-Over-Year Vendor Reorder Rates Among SureCost Pharmacies (2022–2024)
Year-over-Year Vendor Reorder Rates Among SureCost Pharmacies (2022–2024)-agnostic
Year-over-Year Vendor Reorder Rates Among SureCost Pharmacies (2022–2024)-agnostic-1

On the other hand, individual pharmacies saw significant spikes in reorder percentages driving up their COGS. These “outlier” cases illustrate the rising cost as pharmacies have to reorder more items.

The highest reorder-related COGS increase topped $1.95 million .

Anticipate Drug Shortages

Whether a vendor fails to fill an order or an overworked pharmacy manager can’t check inventory on time, reorders are stressful and pricey. They mean scrambling to find another vendor. Staff end up paying more just to get the item that patients need without disrupting their treatment.

That’s why pharmacies use SureCost: By unifying all vendor catalogs into a single solution, they can quickly and easily view all in-stock alternative options. Instead of reacting to backorders at the last minute, they stay proactive because SureCost alerts them about potential drug shortages.

Whether it’s replenishing stock before a potential shortage or conducting routine procurement, SureCost automatically calculates the best purchasing opportunities for the pharmacy, including rebate modeling, GPO pricing and vendor specials.

Adhering to GPO Pricing

Group purchasing organizations (GPOs) use their combined buying power to negotiate better product prices. But member pharmacies don’t save if invoices don’t reflect the GPO price. We continue to see discrepancies between GPO negotiated prices and invoiced prices each year. Unfortunately, the impact of incorrectly priced GPO items remains high.

Unified vendor catalogs help pharmacies avoid reorders and drug shortages.
GPO Non-Compliance Summary
Average percentage of GPO-qualified spend incorrectly priced 14.94%
Highest percentage of total spend on GPO non-compliance 95.88%
Highest percentage of total annual spend on incorrectly priced GPO items 1.97%
Average percentage of total spend lost to incorrectly priced GPO items 0.17%
Year-Over-Year GPO Pricing Discrepancy Rates on Qualifying Spend (2022–2024)
Year-over-Year GPO Pricing Discrepancy Rates on Qualifying Spend (2022–2024) agnostic

Average overcharges have increased since last year, leading pharmacies to lose millions of dollars to overcharges on GPO-qualified items.

These continued rates of incorrectly priced GPO-qualified spend highlight an industry-wide need for automated auditing and contract enforcement tools. The modest decrease in the average percentage of total spend impacted by GPO pricing errors points to the advantage of using a solution like SureCost for better invoice auditing and ensuring vendor pricing compliance.

icon-house
Rising Staff Shortages Continue to Be a Challenge

Pharmacy professionals report higher rates of burnout as they take on even more responsibilities due to a growing and aging patient population.

A Pharmacy Times report found that self-reported burnout more than doubled after the COVID-19 pandemic. In a 2023 Pharmacy Times survey of pharmacists, 76% of respondents cited burnout as contributing to understaffing. 58% of pharmacy professionals surveyed in a 2023 NCPA study reported difficulty filling open positions.

Pharmacy managers must effectively manage the time of their shrinking workforce and help their teams avoid burnout. It’s crucial to optimize processes and reduce tedious manual tasks like invoice validation, receiving and product comparison. A single pharmacy purchasing solution means staff spend less time shopping and more time with patients. The right solution automates repetitive tasks and removes the stress of deciding which products to buy.

Yet pharmacies must find technology that integrates with their existing systems. The right solution helps people do their job (not add hours of training or additional steps to their workflow).
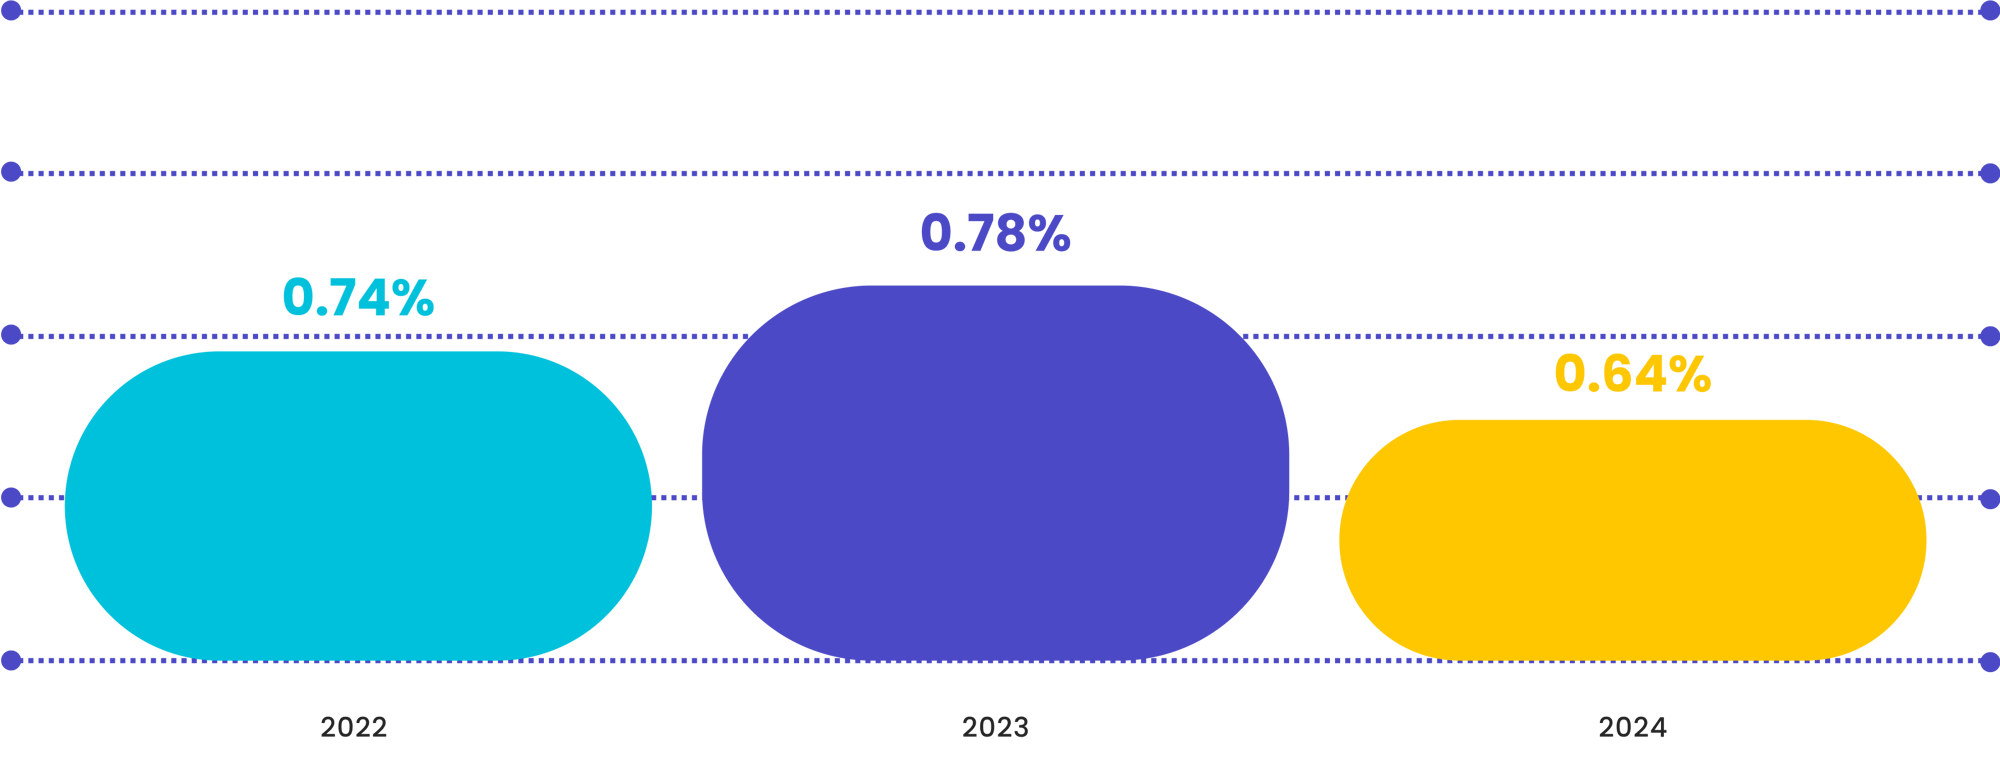
Burnout is rising. Automate tasks so staff can focus on care.
Enhance Purchasing Transparency

Regardless of the trader partner—GPO, primary vendor, manufacturer or secondary vendors—pharmacies have to ensure vendor compliance with negotiated prices. That level of transparency requires an efficient, convenient tool to verify that contracted pricing is honored every time they pay an invoice.

If pricing doesn’t reflect the GPO or a vendor fails to honor their quoted contract price, SureCost sends the pharmacy an alert. The pharmacy then has all the data and history needed to report the problem at their fingertips. SureCost also ensures internal compliance by standardizing pharmacy purchasing strategy across all team members and locations. With electronic “guardrails” in place, staff can adhere to purchasing strategy while ensuring vendor compliance and avoiding costly purchasing errors.

Guaranteeing Accurate Value of Received Goods

Pharmacies are also losing money due to disparities between the actual value of goods received and the amount vendors invoice them. Everyone makes mistakes, including vendors. They might pack the wrong quantity, fail to ship an item, invoice at the wrong price or even fill incorrect items but still bill the pharmacy (a.k.a. “miss-picks”).

As the data below shows, these errors are unintentional but costly and all too common for pharmacies.

Accurate Value of Goods Summary
Maximum variance between overpayment and value of received goods (based on total annual spend) 1.79%
Average variance between overpayment and value of received goods (based on total annual spend) 0.40%
Standard deviation of overcharged invoice 0.54%
Highest overpayment for received goods at a lower value $1,986,936

In 2024, pharmacies overpaid, on average, by less than half of a percentage point against their total COGS for products invoiced but not received, while the range of variances went as high as two percentage points.

Year-Over-Year Vendor Average Variance Between What a Pharmacy Overpaid vs. Received Based on Total Annual Spend (2022–2024)
Year-over-Year Vendor Average Variance Between What a Pharmacy Overpaid vs Received Based on Total Annual Spend (2022–2024) agnostic
One mistake cost almost $2M. Invoice validation tools stop it before it starts.

Every year, SureCost sees a consistent average variance between what a pharmacy overpaid and what they received based on total annual spend. The standard deviation of overcharged invoices remains consistent, signaling a predictable range of small mismatches.

But these seemingly small percentages add up. For example, a pharmacy purchasing approximately $3M annually could be losing nearly $300K each year. Vendors can correct these issues, but pharmacies have to spot the errors and talk to vendors with a sufficient “paper trail” before too much time goes by.

One large pharmacy client lost nearly $2 million due to invoice mismatches in 2024.

Ensure Accountability

SureCost helps pharmacies get what they paid for. Integrated with a pharmacy’s existing systems (like accounts payable and pharmacy management systems), SureCost instantly compares invoices against purchase orders when they’re received. It also makes receiving easier by giving team members a single interface. Pharmacies can be confident that they always get the right product at the correct amount for the agreed-upon price and can quickly and easily rectify any issues.

icon-house
IRA Will Increase Drug Prices for Pharmacies

While the Inflation Reduction Act aims to lower the cost of prescription drugs, drugmakers will compensate for reduced prices by launching new drugs with higher prices. Insurers will adjust coverage to gain similar advantages, and pharmacy benefit managers (PBMs) will change formularies to compensate for lower margins.

To mitigate the impact of rising drug prices, pharmacies should expand their vendor portfolio and shop outside the Top 200 to leverage as many purchasing options as possible. Pricing validation is key; with drug prices increasing, pharmacies should only pay for what they ordered.

Smarter purchasing tools are crucial. Pharmacies that act now—by expanding vendor options, tightening cost controls and adopting smarter purchasing tools—will be best positioned to navigate IRA-driven disruptions and continue delivering critical care to patients.

Takeaways for Smarter Purchasing

Breakdown of Potential COGS Savings by Smarter Purchasing Strategy (2024)
Breakdown of Potential COGS Savings by Smarter Purchasing Strategy (2024) agnostic
Breakdown of Potential COGS Savings by Smarter Purchasing Strategy (2024) agnostic-1
One client saved $2M by catching mismatched invoices. Are you checking yours?

The above data and the guidance collected from interviews with these pharmacy professionals illustrate a few overarching strategies, starting with streamlined purchasing. These pharmacies don’t miss out on savings by juggling catalogs or losing time uploading multiple purchase orders. Instead, with all of their vendors unified into a single solution, they view unit prices for all purchasing options for each item from every vendor, down to the NDC, and purchase through a single interface.

They’re also confident in their data. Accurate, updated catalogs tell them which products are available and flag the best options. Invoices verified against pharmacy purchasing history and contract pricing ensure they always get what they paid for. A complete virtual paper trail lets them report issues to vendors. All that data generates business intelligence metrics to formulate pharmacy purchasing strategies.

These pharmacies also look at compliance from several angles:
  • Primary vendor compliance
  • Vendor compliance with contracted pricing
  • Team compliance with purchasing strategy
  • Pharmacy regulatory compliance, such as DSCSA

A unified pharmacy purchasing solution ensures they have guardrails to manage all these areas, even as they expand their vendor portfolio.

Technology also empowers pharmacies to automate manual processes and repetitive tasks. Instantly verifying an invoice against a purchase order (as outlined above) is one example. Another is using a smarter inventory management solution to alert them when stock reaches a certain level and automate replenishment based on purchasing history.

Above all, the key takeaway is to manage pharmacy purchasing, inventory and compliance as a unified system. Siloing these processes creates more work for everyone. Instead, pharmacy purchasing and inventory management should be integrated into a single source of truth. DSCSA compliance updates make this level of integration even more important. Separate systems may lead to overcharging, but they could now result in regulatory compliance penalties.